The book Structural Engineering of Transmission Lines has a chapter The nature of wires in spans. This chart is from that chapter.
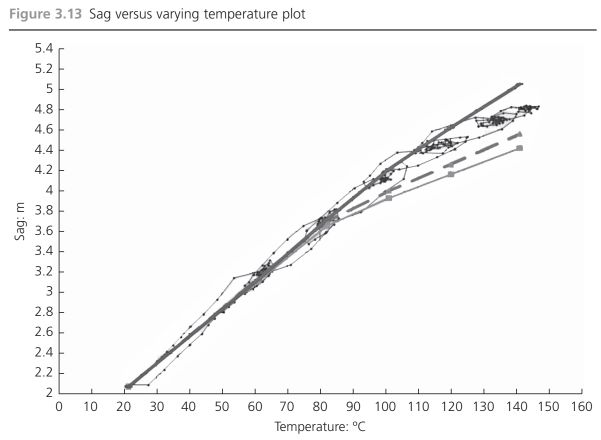
The thin very loopy line is a plot of sag vs temperature as the line temperature is cycled through a rising and falling pattern. It shows, at least for this experiment, that the sag at any temperature can vary by about 0.3m depending on whether the temperature is rising or falling.
There are many factors involved in modelling the behaviour of a power line, some of which are not accurately predictable. It is known that a load applied to a conductor causes permanent elongation, but the length of time that the load is applied also affects the elongation (Permanent elongation of conductors, Electra). How do you model that?

The circle on the left shows shots at a target that are accurate (spread around the centre) but not very precise, on the right are shots that are precise (in a grouping) but not accurate.
It seems we can have mathematical models for power lines that are reasonable to the best of our current knowledge, but let’s not get too keen about having precision to 3 decimal places. Thinking about that 0.3m sag variation in a span with 3m sag, for example, is ± 5%!
References
Structural Engineering of Transmission Lines, Peter Catchpole
Permanent elongation of conductors. Predictor equation and evaluation methods, Electra