One aspect of power lines that is not intuitive is the effect that adding a small length of conductor into a span can make on the sag.
It is well established that a catenary is the best way to model the curve of a power line cable.
“Although commercially available wires and cables are not truly flexible, they will, in very short spans, conform closer to a catenary than to any other curve. In longer spans, the conductors may be considered as truly flexible since they will sag in the shape of a catenary curve.” H Farr, Transmission Line Design Manual, Denver, US Dept. of the Interior, 1980, p. 15
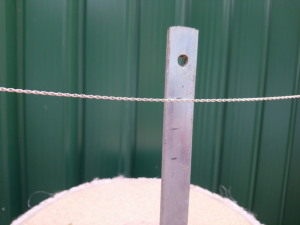
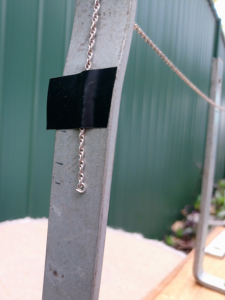
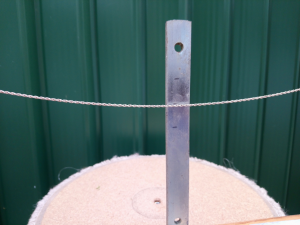
To satisfy my curiosity I conducted a simple experiment using a necklace chain. Using brackets to model the poles I measured the sag and the corresponding length of chain.
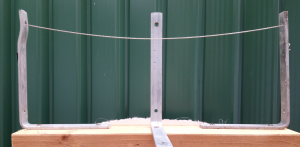
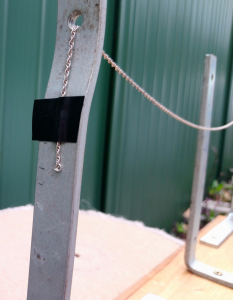
Measurements I took from the model:
| Span length | 436mm |
| 20mm sag | 439mm chain length |
| 40mm sag | 446mm chain length |
| 60mm sag | 457mm chain length |
AS/NZS7000:2016 has equations for the catenary in Appendix R.
\(S=\sqrt{\left ( 2C sinh\frac{L}{2C} \right )^{2}+h^{2}}\tag{R21}\)\(D=C\left ( cosh\frac{L}{2C}-1 \right )\tag{R38}\)
Using equation R38 to calculate catenary constant from sag, then R21 to determine chain length from the catenary constant, I get these results:
| Sag | Catenary constant | Predicted chain length | Measured chain length |
| 20mm | 1.19 | 438mm | 439mm |
| 40mm | 0.60 | 446mm | 446mm |
| 60mm | 0.405 | 457mm | 457mm |
I can observe that the catenary model predicts the “stressed conductor length” (chain length) well within my experimental tolerances.
Now looking at some realistic examples:
80m span of Moon conductor strung at 10% CBL, temperature 15°, standard temperature 15°. Sag is 1.406m. Conductor length is 80.066m.
If we add 20mm of conductor into the span, ie length is 80.086m, Catenary constant is 498.1. Calculated sag is 1.607m, 20cm more!
300m span Raisen strung at 18% CBL. Sag is 4.845m, conductor length is 300.209m.
Adding 100mm conductor increases sag by 1.06m to to 5.909m
| Span | Stringing | Sag (m) | Conductor length (m) | Additional conductor | New sag (m) | Increase in Sag (m) | |
| Moon | 80 | 10% CBL, 15° | 1.406 | 80.066 | 20mm | 1.607 | 0.201 |
| Raisen | 300 | 18% CBL, 15° | 4.845 | 300.209 | 100mm | 5.909 | 1.06 |
Bibliography
Farr H, Transmission Line Design Manual, US Dept. of the Interior, 1980
Jwa Y, Sohn G, A Piecewise Catenary Curve Model Growing for 3D Power Line Reconstruction, Photogrammetric Engineering & Remote Sensing Vol. 78, No. 12, December 2012, pp. 1227–1240
Madaan R, Kaess M, Scherer S, Multi-view Reconstruction of Wires using a Catenary Model, Carnegie Mellon University, https://www.ri.cmu.edu/publications/multi-view-reconstruction-of-wires-using-a-catenary-model-2/
AS/NZS7000, Standards Australia, Sydney, 2016
AmBrSoft Calculators+, http://www.ambrsoft.com/TrigoCalc/Sphere/Arc_.htm (accessed 22 July 2020)